Most Important Google Analytics Metrics for Bloggers and Content Creators
Are you struggling to determine if your blog posts are successful or if their reach is falling short? Do you feel lost in a sea of Google Analytics data? If so, you’re not alone!
Many bloggers and content creators find it challenging to dig through and understand all the information collected by this valuable tool. It’s a complex tool that proves useful for everyone from beginning bloggers to experts in the digital marketing space – but you have to know what data to focus on.
In this blog post, I will break down the most important Google Analytics metrics for bloggers and content creators, including where to find this data, what it means, and how to use it to achieve your content goals.

Metrics vs. Dimensions in Google Analytics
Before we start listing the best Google Analytics metrics to track, let’s take a step back – what is a metric in Google Analytics, anyway?
Metric refers to a numeric measurement or piece of data. They are specific questions that can be tracked, and a number can be assigned to track your progress. They answer the question of how many times something happened. Some more commonly used metrics you are likely already familiar with include page views, sessions, conversion rate, or bounce rate.
Dimensions, however, refer to classifications that can be used to break down or understand the metrics. They allow you to take the information your metrics provide and better analyze precisely what happened. Dimensions include (but aren’t limited to) gender, location, device type, and traffic source (where the traffic came from).
In summary, metrics track how many times something has happened, while dimensions describe what happened in greater detail. This is important to remember as we get into the specific data to track below.
How Can I Access Google Analytics Metrics on WordPress?
The most accurate way to access Google Analytics is to visit the GA website. This provides information straight from the source, without any additional chances of error that come from when there are “too many hands in the pot.” This is also a reliable way to view the data if you are using a different blogging platform.
To begin, you will have to go through the process of installing Google Analytics 4 on your website. If you haven’t done this yet, I recommend visiting our step-by-step guide: “How to Install Google Analytics 4 on WordPress”
If you dislike the way data is shown in Google Analytics or simply want to make it quicker to access by having it in your WordPress dashboard, there are third-party plugins that can be used.
These plugins connect with Google Analytics, so you will still need to take the steps to install it. However, they display the data in more user-friendly formats. Often, these programs also offer the opportunity to set up customized data tracking to focus on specific data points or user journeys.
Some options you may be interested in include:
However, it is important to note that, like any plugin, there is the possibility that these could slow down your website. Some of these options will also come with a hefty price tag to access the information you are looking for. While these are great tools for some, most bloggers and content creators would be better served by learning to find the data they need on the Google Analytics platform for free.
The Best Google Analytics Metrics for Bloggers and Content Creators to Track
Whether viewing your website data directly on Google Analytics or through one of the third-party plugins mentioned above, the data you track and analyze to grow your business/blog online will be the same. I will reference the location on the Google Analytics platform for each of these, but you can search for where to find the same data on the other plugins if you prefer to use one.
The following list will serve as your Google Analytics metrics cheat sheet. I’ll share the metrics you should be tracking and the most important dimensions to understand how this data can be analyzed and used to make business decisions that will move you forward.
Here are 9 Google Analytics metrics to track and how they can be used to help you:
Page Views/Sessions
These metrics specifically track the traffic coming to your website. This data is the most basic information you will collect from GA, but it’s a necessary foundation for your marketing plan. It’s also information most brands will look for when you are pitching a collaboration.
This data can be broken down to better understand your traffic, such as demographics (age, gender, location) or where the traffic comes from (organic search, social media platforms, etc.). This will give you a better idea of who is visiting your website and whether that traffic aligns with your ideal audience/customer. I will dig into some of these dimensions in more detail as we continue…
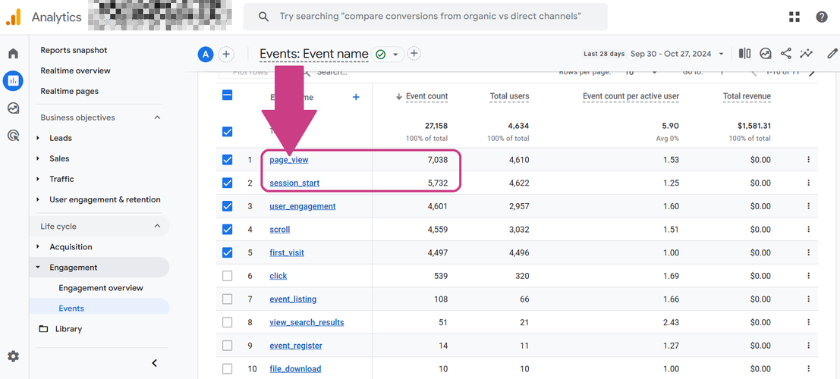
To see your basic page views and sessions, check under Events > Engagement > Events
Location of Traffic
Another important metric for monetization is the location of the people visiting your website. Brands interested in collaborating want to ensure your traffic is in a country where their product or service is available.
If you are monetizing using ads, the location of your traffic will directly impact your RPM (revenue per 1000 visitors). Advertisers will pay more to ensure their ads are shown to people in the countries they are trying to target and those that, traditionally, have higher purchasing power. Therefore, websites with the majority of their traffic coming from the United States, Canada, and Western Europe earn more ad revenue.
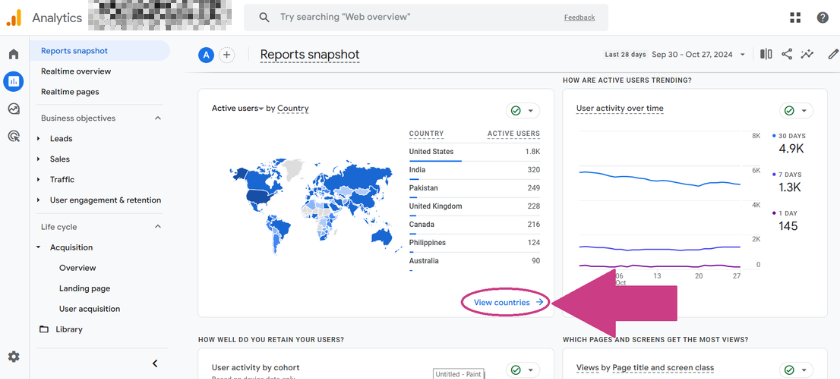
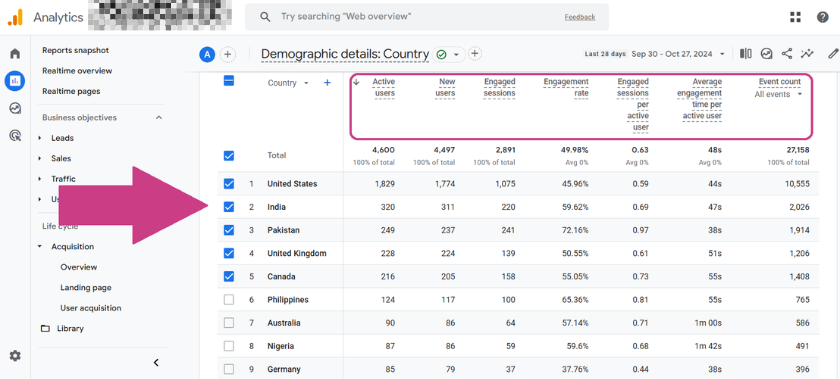
To find the location of your traffic, click on Reports. This will take you to the “Reports snapshot,” which is an overview of the information available. Scroll down to where you see a map. This will list out your top countries. You can click “View countries” for more details, including a breakdown of active users, engagement rate, and other important Google Analytics metrics as they apply to traffic from each country.
Pageviews Per Session
The number of pages (blog posts or pages on your website) a person visits before leaving indicates to search engines like Google that your website offers value. After all, if someone stays on your website to read multiple blog posts, they are clearly getting some value from you. However, if everyone who visits your website closes it out after a single blog post, you’re not showing that you can offer more value to their lives.
This is one of the user behaviors that were highlighted in the leaked Google search internal documents.
Understanding how many pages the average user views in a single session is a good indicator of whether you give reasons for people visiting your site to stick around. Are you leveraging a solid internal linking strategy to direct readers to other relevant pages on your site? Do you have pop-ups, sidebars, or a clear menu that will encourage people to keep reading? Is your website clutter free, making it easy for people to find what they’re looking for?
Improving the number of pageviews per session not only helps with your search performance but it’s also a great way to focus on improving the user experience and nurturing your relationship with your website visitors.
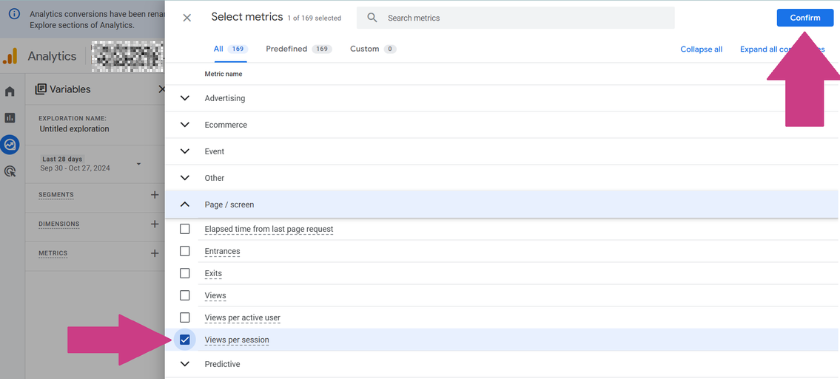
The best way to view your pageviews per session (without doing manual calculations) is to create a report through the Explore tab. Click “Explore” under Reports and select “Blank.” On the page that opens next, select the + beside Metrics, “Page/screen,” and “Views per session” before hitting “Confirm” in the top right corner.
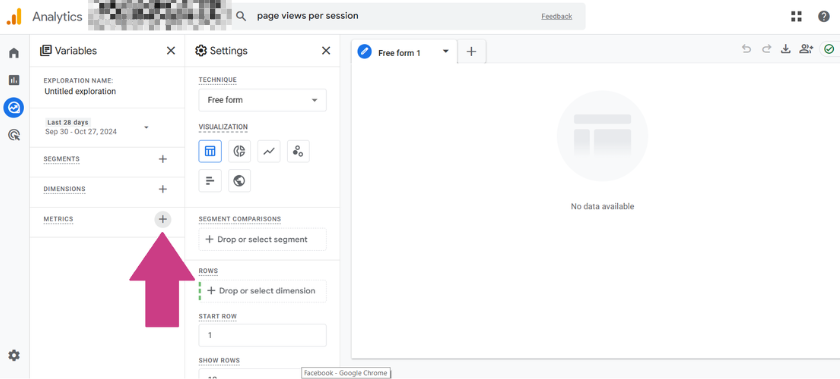
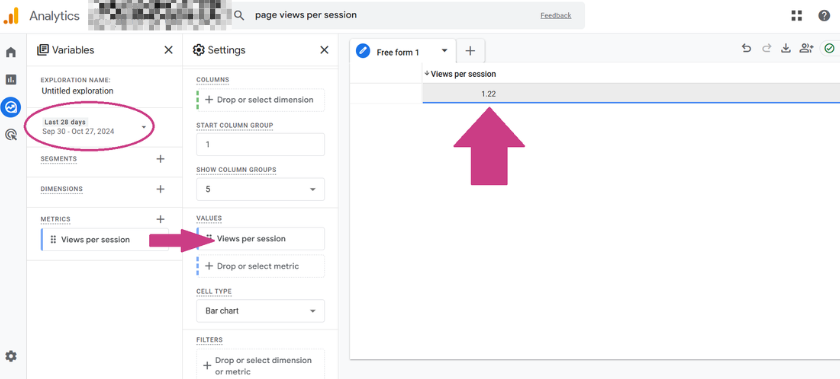
Now, you will see a box that states “Views per session” under Metrics. Click and drag that box into the next column under “Values.” Your views per session will appear. Adjust the dates if you want to look at a different timeframe.
Bounce Rate/Engagement Rate
A popular metric often discussed in the past when referencing Google Analytics for bloggers was bounce rate. This referred to the number of people who came to your website and clicked away after viewing only a single page.
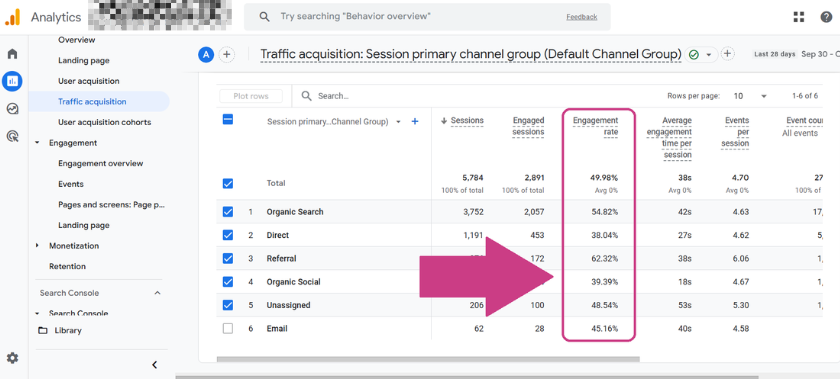
With the move to Google Analytics 4, Google took a more positive spin on this metric. Rather than tracking bounce rate, they now track and report your “Engaged Sessions.” These are the number of sessions that come onto your website and stay for longer than 10 seconds, navigate to a second page (or post), or trigger a conversion event (sale, download, etc.). In short, “Engaged Sessions” is the opposite of Bounce Rate.
To see this, go to Reports > Acquisition > Traffic acquisition
New Vs. Returning Users
Are you attracting a constant flow of new visitors to your website, or have you started to build a community of return readers? Building and fostering relationships is difficult if you only connect with people once, let alone make sales or other conversions. For your business to grow, you want to encourage people to continue engaging with your brand.
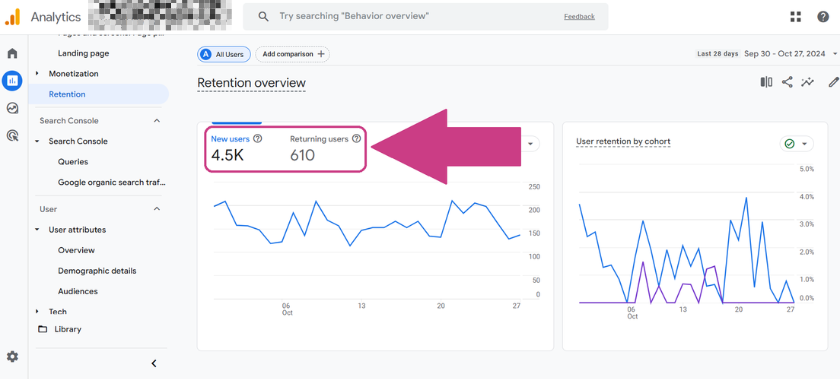
The first step to improving your retention rate is to understand how many new users versus returning users you are attracting.
This metric is very easy to find. Navigate to Reports > Life cycle > Retention
Top Blog Posts/Landing Pages
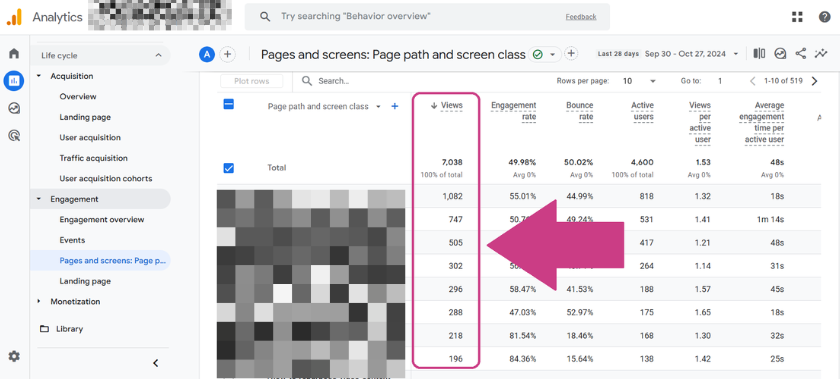
Creating successful content requires understanding what’s working and what isn’t. Some of your blog posts will attract large traffic volumes, while others may not resonate or attract as many readers. One way to determine the success of your posts is to check the traffic specific to each post and see which are performing best. This will also help you identify which topics appeal most to your audience.
To see a list of your blog posts and pages ranked from most pageviews to least pageviews, go to Reports > Engagement > Pages and Screens
Exit Pages
In addition to understanding which pages are the most popular on your website, you can also benefit by knowing which pages are most likely to have people leave after. This could be because the page answers all their questions, creating a natural end to their research. Or it could mean that the page isn’t providing them with enough reasons to keep browsing, potentially even increasing your Bounce Rate.
Take note of any pages with an exceptionally high exit count. Look at the blog post or page through the lens of a website visitor. It’s also important to take note of other factors that could impact that exit rate. For example, does this page have a high sales rate? If so, it could be the wrap-up of your funnel in a positive way.
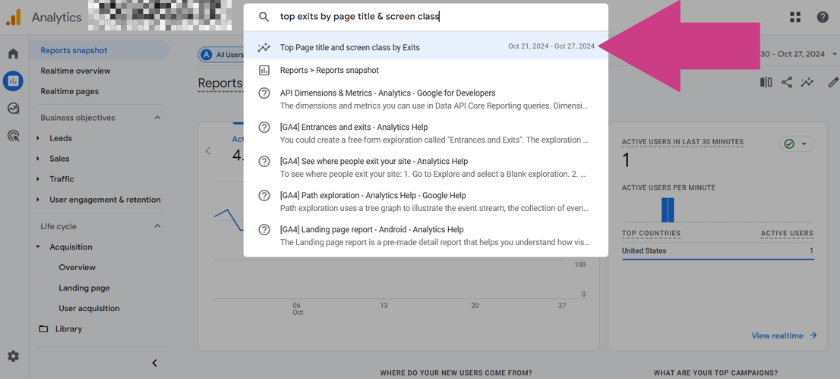
The easiest way to view your exit pages is to type this phrase in the search: “top exits by page title & screen class.” A list of pages with the associated number of exits will appear, ranked from highest to lowest.
Traffic Referral Sources
To create a solid marketing plan, you must consider where people will find and be introduced to your brand or website. Few brands will focus on a single traffic source, instead trying to diversify their efforts and reach people in several different spaces – through organic search, in your email list, on a social media platform, etc.
If you are working on establishing a clear plan to achieve your traffic goals, you need to break down your traffic metrics by source – Where is your traffic coming from? Which traffic sources are working? Where should you consider investing more time and effort?
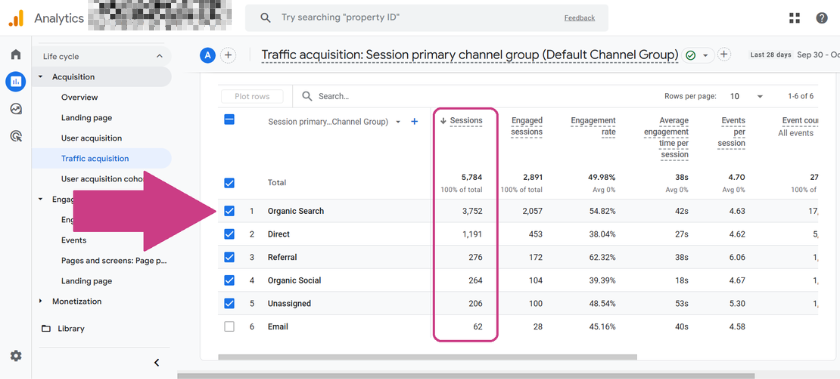
Google Analytics 4 breaks down this analysis of your traffic on a higher and more detailed level. To access the higher-level report, visit Reports > Acquisition > Traffic acquisition
The high-level report groups your traffic metrics into categories such as Organic Search, Organic Social, or Email. The Organic Social category, for example, will include all website traffic that comes organically through a social media platform.
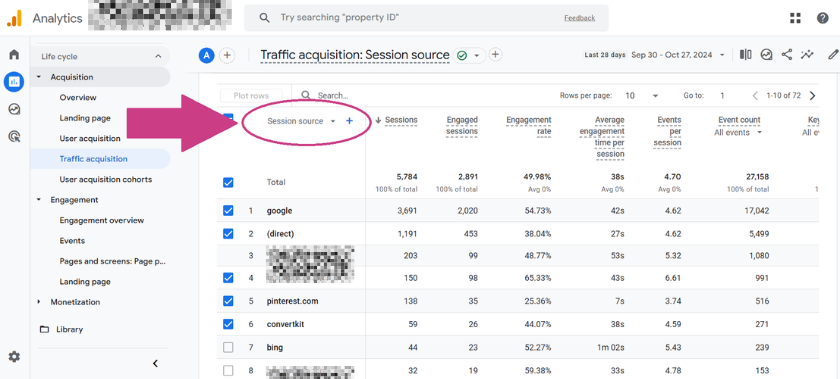
For a more specific breakdown where you can see exactly which social media platform or search engine your traffic is coming from, you must change the drop-down at the top of the chart from “Session primary channel group” to “Session source.”
Conversion Metrics
Finally, you can use Google Analytics to track conversion metrics. What are conversion metrics? These are specific actions that visitors to your website may take to convert them into subscribers, customers, or leads. Where you will find your conversion metrics will depend on what you are trying to track. This can range from readily available information to the need for custom reporting.
You can identify some conversions through the events that Google automatically tracks. To see this, return to the page where you previously viewed pageviews and sessions (Reports > Engagement > Events).
This screenshot shows several conversions, including event registration, file downloads, and purchase.
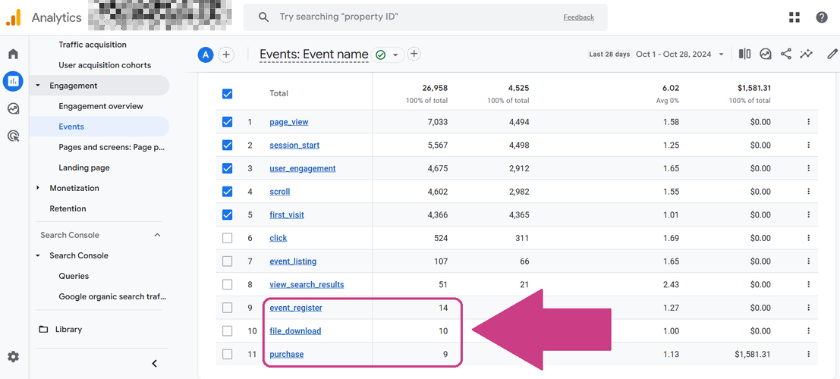
If you want more specific conversion reporting, you may need to create custom reports using the Explore option or set up tracking links and other factors to collect data. Some plugins and systems will independently track this data outside of Google Analytics, like the number of subscribers from a specific sign-up form.
Final Thoughts: Key Google Analytics Metrics for Content Success
Google Analytics is a powerful tool that can provide valuable insights into your blog or website’s performance. By understanding and tracking the metrics outlined above, you can gain a deeper understanding of who is visiting your website and identify areas for improvement to make smart data-driven decisions to grow your online business.
Remember, the key to success lies in not only monitoring and tracking this data but also analyzing and interpreting what this means for your content marketing. You can use these metrics to identify trends, measure the impact of your content, discover what’s resonating with your audience, and improve your marketing plan moving forward.
Many bloggers and content creators find Google Analytics overwhelming, but it doesn’t have to be. Focus on the metrics most relevant to your business goals – starting small if necessary. Pick one of the many important Google Analytics metrics from the list above to start with and build upon your understanding from there.
Before long, you’ll be harnessing the power of this FREE and valuable tool to improve your digital marketing efforts and achieve your business goals!
About the Author: Britt Kascjak, BlogPaws Director of Content & SEO, is an award-winning freelance writer whose background in digital and social media marketing spans 15+ years. She’s been a content creator in the pet industry for 9+ years with her own blogs: Shed Happens, The Kas Pack, and Lucifer the Rescue Pup where she shares her life and outdoor adventures with her 2 dogs and 3 cats. Read more…


Hello, I am doing the part you mentioned above to see how many page views per session. What numbers are good, what are average, what are bad? I think it says 1.22 in your example but it’s hard to read. Mine says 1.41. So does that mean users are looking at almost 1.5 posts on average? So maybe clicking on another thing but not enough users doing it to be considered 2 page/post views? Thanks for your help, this is a useful article!