Best Practices for Including Infographics in Your Blog Posts
I didn’t know much about infographics, including why they were valuable and how to best use them in my blog posts and on social media until I started reading fellow pet blogger’s sites. The content was phenomenal, but I found myself zeroing in on the infographic they included. The image was like the cliff’s notes of the entire post, except I didn’t feel like I was cheating on an assignment! Instead, I felt compelled to act and wound up sharing the image with my followers.
So, what are the essential things you should know about how to create, integrate and share these useful tools? This post will help to walk through some key elements that are associated with optimizing infographics.
What’s an Infographic?
There are different variations of infographics, each with their own value for use. In short, they are visual representations of the information included in the post you’re writing. For example, if you’re writing about signs your dog may be exhibiting that he’s stressed, instead of simply using the term “whale eye,” you can include an infographic that depicts different signs of stress, including whale eye. The infographic could be an easier way for the reader to process the information, especially if they’re a visual learner.
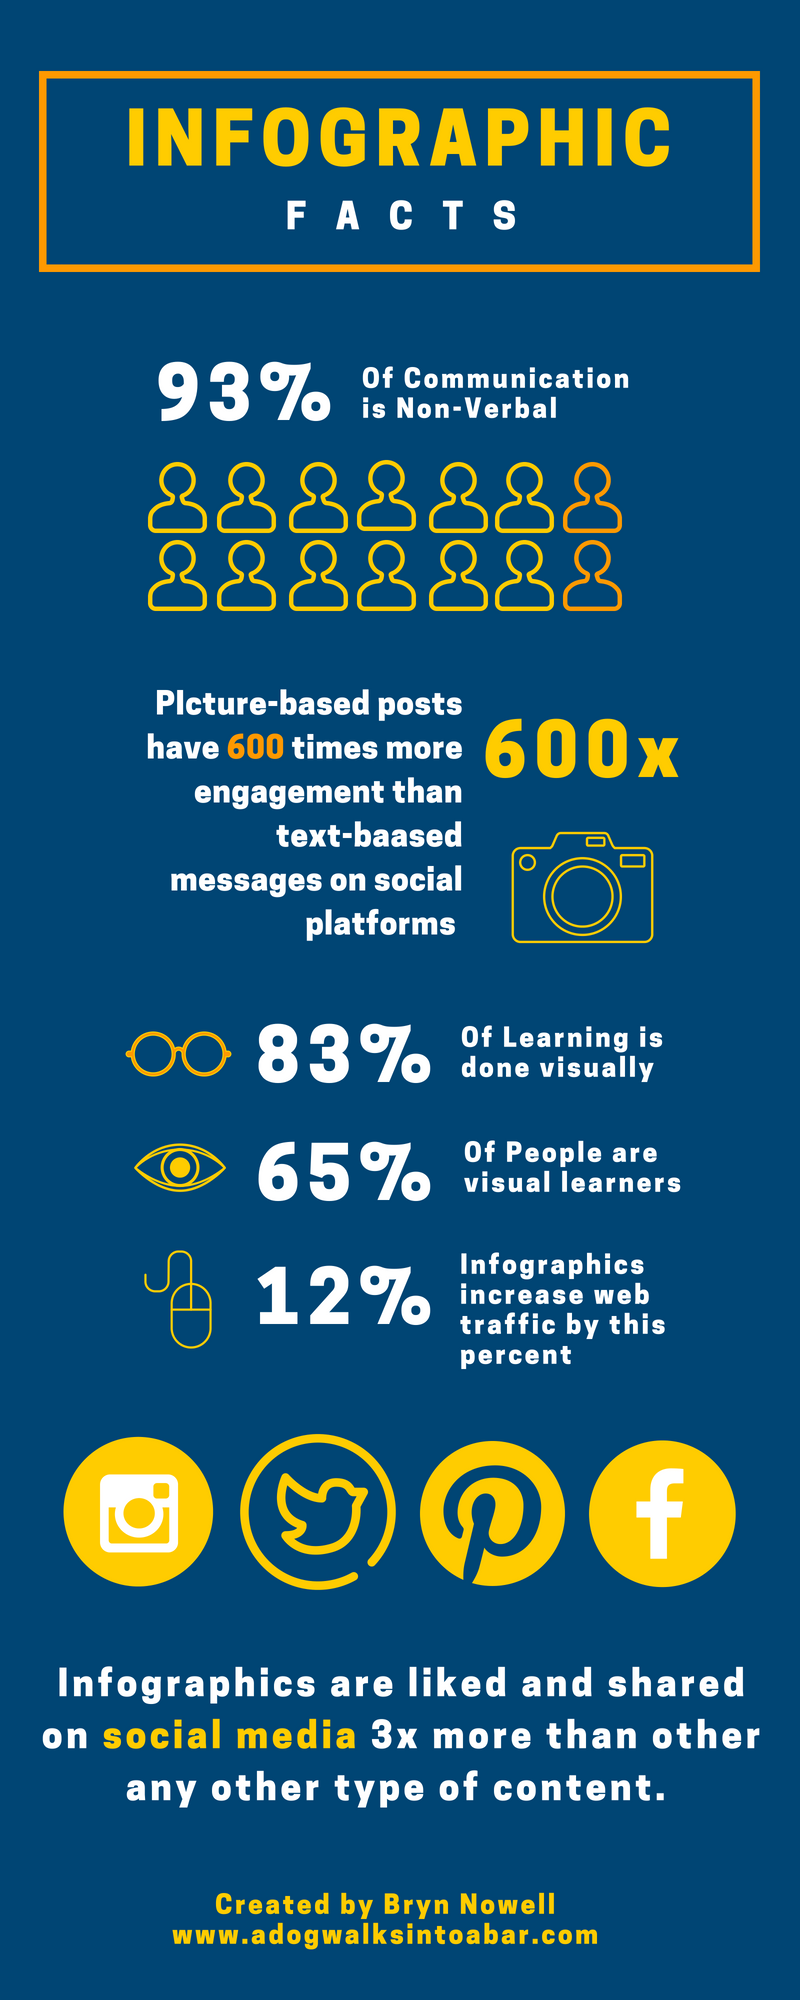
There are tons of ways to structure your infographics; I’ve seen infographics that provide impactful statistics with corresponding images, graphs that illustrate a point, short statements partnered with a graphic and some with just images and no text. One way isn’t technically better than another and you can switch up the format depending on the content you are writing about.
When Should You Use an Infographic?
There’s no right or wrong. The question you should ask yourself when considering using an infographic is “does a visual representation of this information add to the value of this post?” There are times when it may not.
If I’m writing a personal story about the first day I brought my dog home, sharing photos of her in her new space makes sense, an infographic does not. Conversely, if I was sharing an educational post on the top five things to plan for when bringing a dog home for their first day, a visual depiction of this information would add substance to the post.
Posts that include educational information, an attempt to persuade the reader, descriptions of information, like a DIY, are all times when an infographic may make sense.
Do You Have to Make Your Own Infographic?
Not necessarily. I’m not a graphic designer, nor am I skilled at illustration. I often find myself limited by my lack of ability in this area. That said, there are some great infographics that already exist that you may be able to integrate into your post. Type your subject into a search and see if other images come up.
WARNING: First, make sure you have permission from the person who created the image to use in your post. Second, make sure the content is accurate. I’ve seen a lot of posts on Pinterest talking about “safe human medications to give dogs,” and some incorrectly share drugs that should not be administered without, at the very least, conferring with a veterinary professional.
How Do You Make an Infographic?
I have successfully created an infographic, without any graphic design experience. In fact, I found the experience so rewarding, I kicked myself for avoiding making one sooner!
There are a variety of tools you can use to create an infographic without much strife. The tool I find myself using most often is Canva. One of the main reasons why I’ve gravitated to this medium is that I can create images on a computer and my phone, which means I am not restricted by lack of access. I also like this platform because they have an infographic option already created, which is sized for optimizing in social sharing, particularly Pinterest.
If you would rather use another platforms, the world is your oyster. I typed into a search bar “tools to make Infographics,” and was greeted with tons of free and paid options to choose from. There will be a learning curve for any option you choose, so make sure you give yourself some time to navigate the options and feel comfortable with using them.
Once you’ve determined your platform, it’s time to start creating your infographic. I find it helpful to map out what I’m hoping to convey on a piece of paper first. Just like mapping an outline for a piece you’re writing, it helps you to stay on track. As mentioned earlier, it is helpful to brainstorm and determine which type of images are most useful to illustrate the point you are trying to make. Is it a series of statistics? Should you include a relevant graph? Mapping out your content can help you to make that decision.
When creating your infographic, remember the K.I.S. system—Keep It Simple! Make sure the images are easy to see, words are easy to read, and your points are easy to ascertain. Remember, this is a visual that helps to share information, but you’re hoping people are clicking through to read more on your blog. If you give it all away in your infographic, they have no reason to be visiting your site.
However, to be honest, you kind of need to get your hands dirty and play around when making an infographic. Once you do, you’ll realize it’s actually kind of fun to be sharing your information in a different way. If you are new to creating an infographic, it’s always a wise choice to send a draft along to trusted friends who may be able to provide insight on content and layout that you may not have thought of.
Optimizing Your Infographic on Social Channels
When making a post, try to make the key points visible at the top of the infographic. Depending on which social platform you’re sharing images on, the whole image may not be visible. What this means is that you want to make sure that the most compelling information to prompt a click-through to be what’s seen, in order to increase the likelihood of click-throughs and social sharing.
Many people visiting your blog are doing so on their phone or on a tablet, so it’s really important to test out your infographic on both to see how it shows up. I’ve personally clicked away from posts where the infographic was too tiny for me to read on my phone.
While it’s entirely possible for your infographic to be shared on different social channels, the most “visual” of the social channels is Pinterest. Therefore, I recommend focusing on optimizing your image for displaying well on Pinterest. If you are using templates or design resources to help you create your infographic, it will likely already be sized to work well on Pinterest. There is no length limitation on Pinterest, but there is a width restriction, so longer posts are better to create than wide posts.
The keywords you use in your Pinterest description behave like any other SEO search engine, so make sure you’re spending time on crafting it in such a way that your infographic comes up in searches. Once your image is found, make sure your blog name is on the infographic and that it links back to your post to ensure you get traffic to your site. There have been times when my image has been re-shared and is no longer connected to my original post. I have found this out by doing a google image search of the infographic and seeing where it’s popping up. In those cases, I file a takedown request with Pinterest and they typically remove the imposter shortly after the request is made.
That’s a Wrap
This post has covered a lot of different parts associated with the creation and use of infographics. It’s kind of like the first time you show up at a buffet, and you grab a little bit of everything to see where you’re going to head when it’s time to come back and fill up your plate.
Please post your own best practices and questions so we can help to dive into any of the subjects listed in more detail. If you haven’t created an infographic yet, I hope this post has empowered you to work on making one and sharing it. We’d love to see your work and I encourage you to post them here or on the BlogPaws social channels.
Bryn Nowell is an award winning lifestyle blogger who curates A Dog Walks into a Bar, which highlights her love for drinking and dogs. She has been blogging for over three years and prides herself on her visual storytelling. The focus of her posts and photos are her two Boston Terriers, Bean and Yoda. Nowell has a Bachelor’s Degree in Public Relations and her Masters in Business Administration with a Marketing concentration from Quinnipiac University. She has written educational posts regarding business, public relations, and marketing best practices for the BlogPaws network multiple times.